
EDG DAO Financial Bulletin: 2nd Fortnight of November
Provides the community a fair idea about the performance of EDG as compared to the market as well as the peers of EDG.

(** the figures mentioned in this report are our personal opinions, so please don’t consider this as an investment advice)
Part 1: EDG Performance
Source: Coingecko
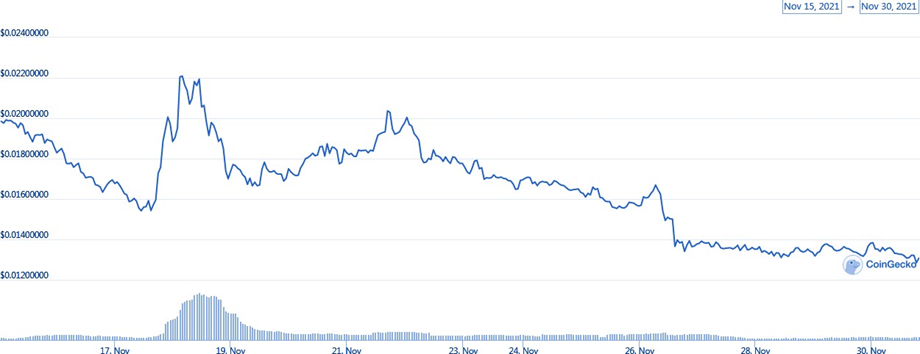
➔ In the initial part of the fortnight the price was on a downward curve, with the volumes traded also being relatively low, and a trend reversal was expected.
➔ The trading volume was substantially high between 18/11/21 and 19/11/21, also the price showed a steep rise on the corresponding days, so it suggests a very bullish period.
➔ From 20/11/21 onwards, the volume traded as well as the price corrected significantly.
➔ From 22/11/21 onwards, till 26/11/21 the price of EDG was constantly decreasing and on 27/11/21 a significant dip in price as well as volume traded was seen. After this, the price has been moving sideways and the volumes are also significantly low.
➔ Now based on the data below and historical trends, another spike in prices and a trend reversal i.e. positive returns for the next period are around the corner.
➔ These negative return rates were mentioned in the last presentation, but the negative rate was exacerbated due to the external factors happening around the globe. At the same, the trend is in line with the overall movement of the market.
Part 2: Comparative Analysis
● Period = 2 weeks (15/11/2021 to 30/11/2021)
● Beta = Volatility Factor
● Rf = Risk-free return (Approximately 4%) (Government Bonds)
● Rm = Return from Equity market (Approximately 10%)
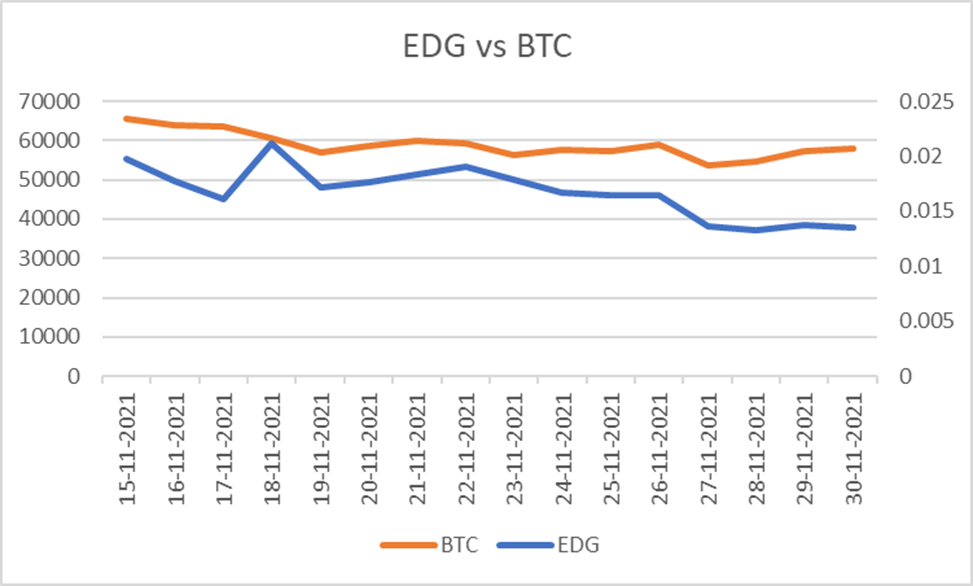
➔ Beta = 0.0004 (Beta is much less than 1 which shows EDG was very less volatile as compared to BTC over the considered Period)
➔ The approximate Return over this period from EDG was about -31.49%
➔ The approximate Return over this period from BTC was about -11.88%
➔ **Considering the above data, the expected returns from EDG can be expected to be about 4% Approximately over the next periods.
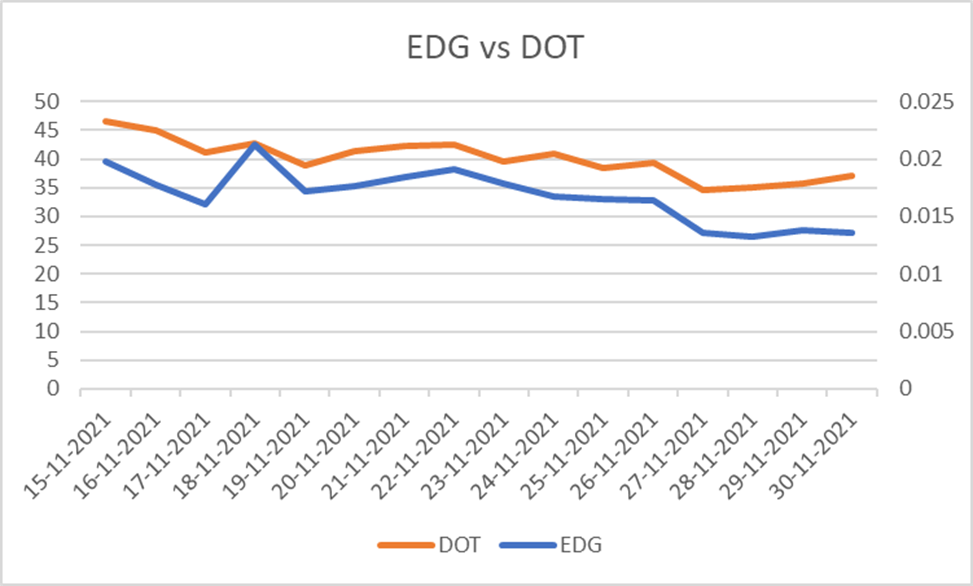

➔ Beta = 0.0005 (Beta is very less than 1 which shows EDG was a lot less volatile as compared to DOT over the considered Period)
➔ The approximate Return over this period from EDG was about -31.49%
➔ The approximate Return over this period from DOT was about -20.18%
➔ **Considering the above data, the expected returns from EDG can be expected to be about 4% Approximately over the next periods.
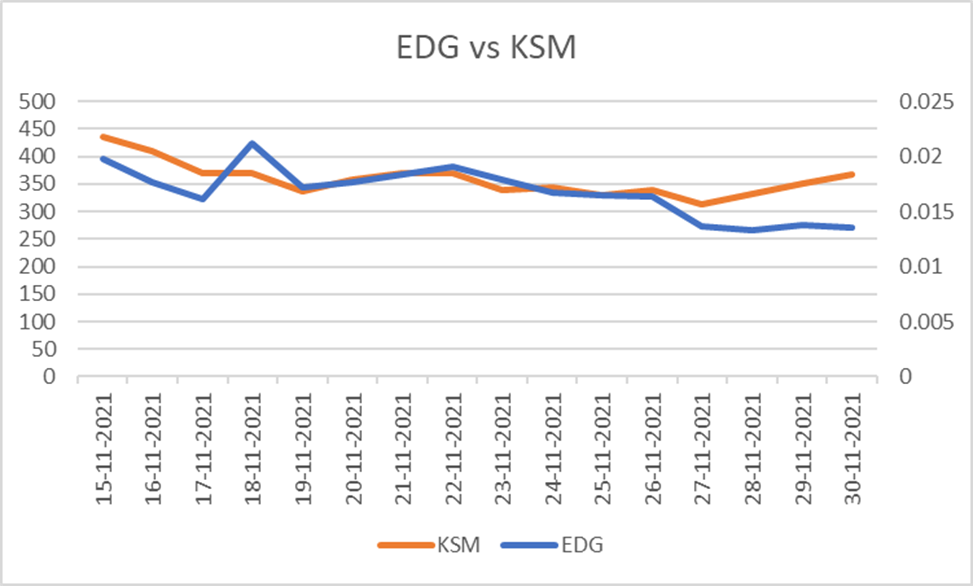

➔ Beta = 0.0004 (Beta is very than 1 which shows EDG was less volatile as compared to KSM over the considered Period)
➔ The approximate Return over this period from EDG was about -31.49%
➔ The approximate Return over this period from KSM was about -15.99%
➔ **Considering the above data, the expected returns from EDG can be expected to be about 4% Approximately over the next periods.
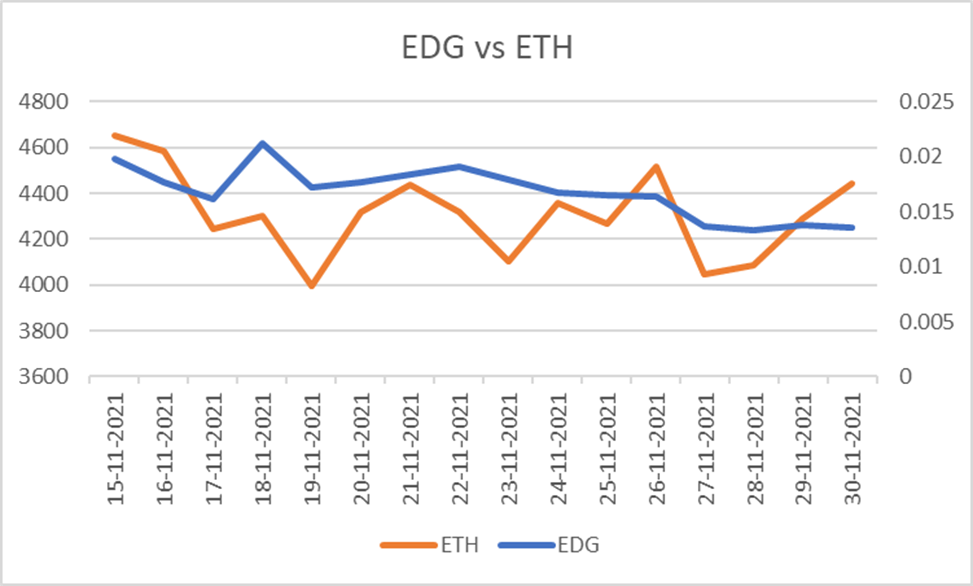
Conclusion: Over the period considered for analysis, the EDG token was very very less volatile as compared to DOT, KSM, ETH, BTC (considering external factors). Also, the returns in this period were negative as expected, but from a realistic point of view and based on the financial models, **the returns over the next period can be expected to be positive and more than 4% **