
EDG DAO Financial Bulletin: Second Fortnight of January
Provides the community a fair idea about the performance of EDG as compared to the market as well as the peers of EDG.

(** the figures mentioned in this report are our personal opinions, so please don’t consider this as investment advice)
Part 1: EDG Performance and Technical Analysis
Image Source: CoinGecko

- During the last fortnight, the overall performance of EDG was Bearish, with a couple of small upward spikes in the prices and volumes.
- In this fortnight, the highest price of EDG was approximately 0.0076 USD around 16/1/22.
- The second spike was around 21/1/21 with prices slightly going up from 0.0056 USD to 0.0063 USD and 24h volume during this period were around 1.28M USD
- The 24 hr volume was higher than normal between 21/1/22 and 23/1/22 and between 26/1/22 and 28/1/22 with the max 24 hr volume traded was around 21/1/22 which was approx 2.3M USD.
- Based on the financial models, we can find that the returns are expected to be around **10% -12% over the next period.
Technical Analysis (Period Considered: Nov’21- Jan’22)

Exponential Moving Average
An exponential moving average (EMA) scales the data according to its newness. Recent data gets the maximum weightage and the oldest gets the least weightage.
In a typical crossover system, the price chart is overlaid with two EMAs. The shorter EMA is faster to react, while the longer EMA is slower to react.
The outlook turns bullish when the faster EMA crosses and is above the slower EMA. Hence one should look at buying the asset. The trade lasts up to a point where the faster EMA starts going below the slower EMA.
From the above chart, close to 13/12/2021, the EMA crossover occurred, when faster EMA(50 day), crossed and moved below the slower EMA, which can act as a good indicator to sell, as this suggests a bearish trend.
Relative Strength Index(RSI)
RSI is a leading momentum indicator that helps in identifying a trend reversal. The objective of using RSI is to help the trader identify oversold and overbought price areas. When the RSI reading is between 20 and 0, the security is supposed to be oversold and ready for an upward correction. When the security reading is between 80 and 100, the security is supposed to be heavily bought and is ready for a downward correction.
From the above graph, the RSI around the start of November was close to 70, which is theoretically a good signal to sell, as it indicates the beginning of a probable bearish trend.
Moving Average Convergence Divergence(MACD)
As the name suggests, MACD is all about the convergence and divergence of the two moving averages. Convergence occurs when the two moving averages move towards each other, and divergence occurs when the moving averages move away from each other. A standard MACD is calculated using a 12 day EMA and a 26 day EMA.
MACD Crossover: This comes in the form of an additional MACD component which is the 9-day signal line. A 9-day signal line is an exponential moving average (EMA) of the MACD line.
(i) The sentiment is bullish when the MACD line crosses the 9 day EMA wherein MACD line is greater than the 9 day EMA. When this happens, the investor should look at buying opportunities
(ii) The sentiment is bearish when the MACD line crosses below the 9 day EMA wherein the MACD line is lesser than the 9 day EMA. When this happens, the investor should look at selling opportunities.
A lot of instances of the above conditions can be observed in the chart given above.
Part 2: Comparative Analysis
- Period = 4 weeks (1/1/2022 to 31/1/2022)
- Beta = Volatility Factor
- Rf = Risk-free return (Approximately 4%) (Government Bonds)
- Rm = Return from Equity market (Approximately 10%)

- Beta = 1.41 (Beta is more than 1 which shows EDG was more volatile than BTC)
- The approximate Return over this period from EDG was about -23.89%
- The approximate Return over this period from BTC was about -18%
- **Considering the above data, the expected returns from EDG can be expected to be about 12.51% Approximately over the next periods.

- Beta = 1.05 (Beta is more than 1 which shows EDG was more volatile as compared to DOT over the considered Period)
- The approximate Return over this period from EDG was about -23.89%
- The approximate Return over this period from DOT was about -31.85%
- **Considering the above data, the expected returns from EDG can be expected to be about 10.33% Approximately over the next periods.

- Beta = 0.88 (Beta is less than 1 which shows EDG was less volatile as compared to KSM over the considered Period)
- The approximate Return over this period from EDG was about -23.89%
- The approximate Return over this period from KSM was about -43.16%
- **Considering the above data, the expected returns from EDG can be expected to be about 9.33% Approximately over the next periods.

- Beta = 1.09 (Beta is more than 1 which shows EDG was more volatile as compared to ETH over the considered Period
- The approximate Return over this period from EDG was about -23.89%
- The approximate Return over this period from ETH was about -29.19%
- **Considering the above data, the expected returns. from EDG can be expected to be about 10.59% Approximately over the next periods.

- Beta = 0.89 (Beta is Less than 1 which shows EDG was less volatile as compared to AVAX over the considered Period)
- The approximate Return over this period from EDG was about -23.89%
- The approximate Return over this period from AVAX was about -37.86%
- **Considering the above data, the expected returns from EDG can be expected to be about 9.39% Approximately over the next periods.
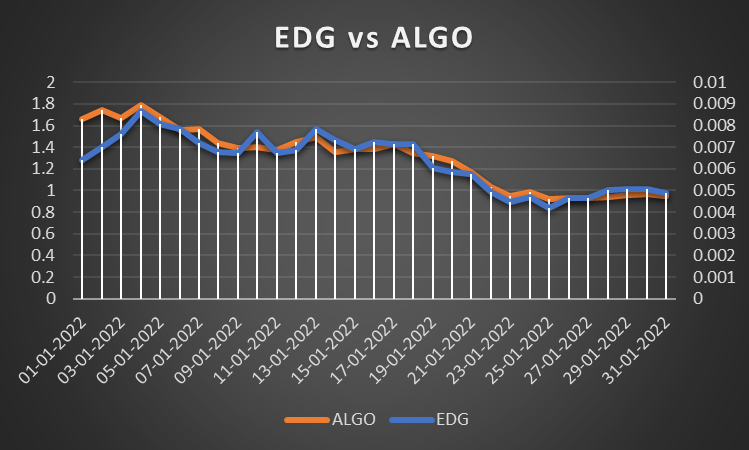
- Beta = 1.11 (Beta is more than 1 which shows EDG was more volatile as compared to ALGO over the considered Period)
- The approximate Return over this period from EDG was about -23.89%
- The approximate Return over this period from ALGO was about -43.16%
- **Considering the above data, the expected returns from EDG can be expected to be about 10.71% Approximately over the next periods.
Conclusion:
Over the period considered for analysis, the EDG token was less volatile as compared to KSM, AVAX, and more volatile wrt ETH, ALGO, DOT, and BTC. Based on the financial models, **the returns over the next period can be expected to be positive and around 10% to 12% **