
EDG DAO Financial Bulletin: Second Fortnight of February
Provides the community a fair idea about the performance of EDG as compared to the market as well as the peers of EDG.

(** the figures mentioned in this report are our personal opinions, so please don’t consider this as investment advice)
Part 1: EDG Performance and Technical Analysis

- During the last fortnight, the overall performance of EDG was Bearish.
- In this fortnight, the highest price of EDG was approximately 0.005USD around 18/2/22.
- The second spike was around 21/1/21 with prices slightly going up from 0.0056 USD to 0.0063 USD and 24h volume during this period were around 1.28M USD
- The 24 hr volume was highest between 25/2/22 and 26/2/22 with the max volume traded being around 205k USD. For a brief period before this, the price showed a sharp downward movement with slightly high volume, which suggests sell off.
- And on 25/2/22, the price as well as volume traded picked up sharply, which suggests strong buying activity.
- Based on the financial models, we see that the returns are expected to be around **4% to 5% over the next period.
Technical Analysis (Period Considered: Nov 21- Feb 22)

Figure 1

Figure 2
Exponential Moving Average: (figure 1.1)
As evident from the above graph the faster moving Exponential Moving Average(25 day EMA)(pink line) is below the slower moving Exponential Moving Average(50 day EMA) (black line), which indicates that the price is trading at lower than usual. A good indicator to buy in this EMA model is when the faster EMA(pink) converges and moves above the slower EMA(black), as the prices are expected to be on an upward trend after the occurrence of this event . Also the current price of EDG is 0.003 and support is offered at 0.0038, which is in line with the above discussion.
Relative Strength Index(RSI) : (figure 1.2)
Theoretically, when the RSI is between 0 and 20, the token/asset is considered to be oversold and can move in upward correction. On the other hand, when the RSI is between 80 and 100, the security is considered to be heavily bought and so can show a downward movement from that point. From the above graph, the current RSI is 36 which suggests that the current status of EDG can be considered near to but not actually oversold, and therefore there is a possibility of an upward movement soon.
Moving Average Convergence Divergence(MACD): (figure 1.3)
A standard MACD is calculated using a 12 day EMA and a 26 day EMA. MACD Crossover comes in the form of an additional MACD component which is the 9-day signal line. A 9-day signal line is an Exponential Moving Average (EMA) of the MACD line. The sentiment is bullish when the MACD line crosses the 9 day EMA wherein MACD line is greater than the 9 day EMA. When this happens, the investor should look at buying opportunities. The sentiment is bearish when the MACD line crosses below the 9 day EMA wherein the MACD line is lesser than the 9 day EMA. When this happens, the investor should look at selling opportunities. Currently, we can see the signal line (red) converging with the MACD line(black) and is expected to go above the MACD based on other indicators.
Bollinger Bands : (figure 2)
BBs are used to determine overbought and oversold levels, where a trader will try to sell when the price reaches the top of the band and will execute a buy when the price reaches the bottom of the band. The BB has 3 components: 1. Middle line which is The 20 day simple moving average of the closing prices 2. An upper band – this is the +2 standard deviation of the middle line 3. A lower band – this is the -2 standard deviation of the middle line.
Based on the graph, currently the price of EDG is at the lower end of the BB envelope, which is an indicator for future upward movement.
Part 2: Comparative Analysis
- Period = 2 weeks (16/2/2022 to 28/2/2022)
- Beta = Volatility Factor
- Rf = Risk-free return (Approximately 4%) (Government Bonds)
- Rm = Return from Equity market (Approximately 10%)

- Beta = 0.07 (Beta is less than 1 which shows EDG was less volatile than BTC)
- The approximate Return over this period from EDG was about -23.45%
- The approximate Return over this period from BTC was about -15.19%
- **Considering the above data, the expected returns from EDG can be expected to be about 4.44% Approximately over the next periods.
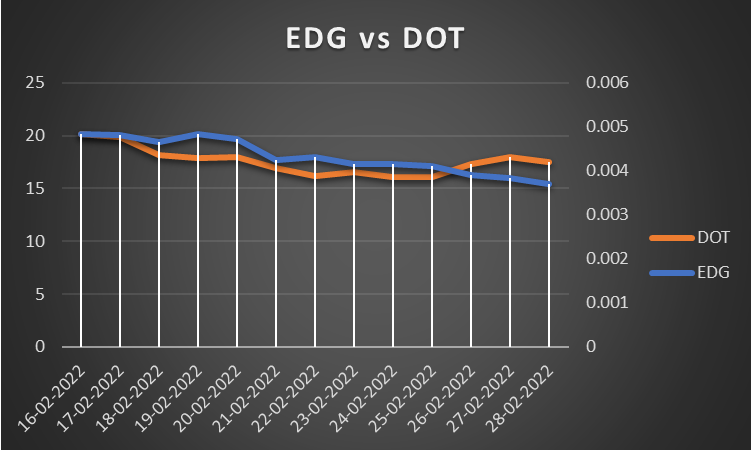
- Beta = 0.003 (Beta is less than 1 which shows EDG was less volatile as compared to DOT over the considered Period)
- The approximate Return over this period from EDG was about -23.45%
- The approximate Return over this period from DOT was about -13.15%
- **Considering the above data, the expected returns from EDG can be expected to be about 4.02% Approximately over the next periods.

- Beta = -0.88 (Beta is less than 1 which shows EDG was less volatile as compared to KSM over the considered Period)
- The approximate Return over this period from EDG was about -23.45%
- The approximate Return over this period from KSM was about -33.14%
- **Considering the above data, the expected returns from EDG can be expected to be about 3.47% Approximately over the next periods.

- Beta = 0.01 (Beta is less than 1 which shows EDG was less volatile as compared to ETH over the considered Period
- The approximate Return over this period from EDG was about -23.45%
- The approximate Return over this period from ETH was about -17.29%
- **Considering the above data, the expected returns. from EDG can be expected to be about 4.07% Approximately over the next periods.

- Beta = 0.02 (Beta is Less than 1 which shows EDG was less volatile as compared to AVAX over the considered Period)
- The approximate Return over this period from EDG was about -23.45%
- The approximate Return over this period from AVAX was about -19.25%
- **Considering the above data, the expected returns from EDG can be expected to be about 4.15% Approximately over the next periods.

- Beta = 0.047 (Beta is less than 1 which shows EDG was less volatile as compared to ALGO over the considered Period)
- The approximate Return over this period from EDG was about - 23.45%
- The approximate Return over this period from ALGO was about -17.88%
- **Considering the above data, the expected returns from EDG can be expected to be about 4.28% Approximately over the next periods.
Conclusion:
Over the period considered for analysis, the EDG token was less volatile as compared to KSM, AVAX, DOT, ETH, ALGO, and BTC. Based on the financial models, **the returns over the next period can be expected to be positive and around 4-5% **
Part 3: Treasury Spendings
Treasury Proposals
- Treasury Proposal #46 - Recruitment of Flipchan as Edgeware Runtime Core Developer - 5,238,095 EDG
- Treasury Proposal #47 - Kabocha Crowdloan Interface + App from Johan and Jan - 3,061,224 EDG
- Treasury Proposal #48 - Kabocha, initial runtime development and support from Elio - 997,949EDG
- Treasury Proposal #49 - Kabocha's Para-ID deposit for Kusama - 2,057,712 EDG
- Treasury Proposal #50 - OnFinality High Performance Public Infrastructure (Q4 2021) - 525,391.29EDG
Treasury Tips:
- jmoxayjwtZozJ6rr64ikaXhsZa7SZm7ihPwajvtodqXrmnj (Johan) - For their creative work and dedication on designing the Edgeware website (initial contributions, non incentivized) - 233,000 EDG
- mae7JWE1EEMLcno2ZSB8dahwPqVPEyh8zik6dgNpQTvvucq - Support with CW Forum Bot - 16,000 EDG
- iyTi5WSqp1kE4TLaDYRq15Z7ry3Ws1FNqEQznvi83apGXKH - Carlos (TG @Carlosmason) aka Head Community Mod did moderation for 3+ months before the onboarding of new community mods - 350,000 EDG
- k3gZiR72D8t9ofcG37X2Ba2U2DbZio3adJu6uoc149fELgn - Russian translation of Edgeware Wiki/Docs - 300,000 EDG
- jYv1mozd5KbFGabpj9btRk6PhqoDpoASXhzsCgzc2QQXPHE (ZOVERN) - Community Research/Findings: Forum, Website, EdgeApps suggestions' by Zombii_OG/ZOVERN - 70,000 EDG