
EDG DAO Financial Bulletin: First Fortnight of February
Provides the community a fair idea about the performance of EDG as compared to the market as well as the peers of EDG.

(** the figures mentioned in this report are our personal opinions, so please don’t consider this as investment advice)
Part 1: EDG Performance
Image Source: CoinGecko

- During the last fortnight, the price of EDG mostly showed a sideways movement.
- In this fortnight, the highest price of EDG was approximately 0.0057 USD around 08/02/22.
- There was a spike in prices on 8/02/22 when prices rose from 0.0048 to 0.057 USD.
- The 24 hr volume was higher between 4/2/22 and 6/2/22 and between 8/2/22 and 10/2/22 with the max 24 hr volume traded being approximately 2.37M USD.
- Based on the financial models, we can find that the returns are expected to be around **9-11% over the next period.
Part 2: Comparative Analysis
- Period = 2 weeks (1/2/2022 to 15/2/2022)
- Beta = Volatility Factor
- Rf = Risk-free return (Approximately 4%) (Government Bonds)
- Rm = Return from Equity market (Approximately 10%)
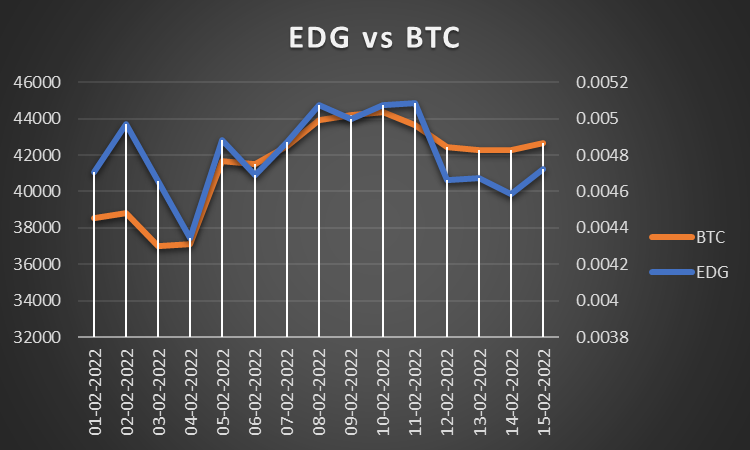
- Beta = 1.19 (Beta is more than 1 which shows EDG was more volatile than BTC)
- The approximate Return over this period from EDG was about 0.37%
- The approximate Return over this period from BTC was about 10.58%
- **Considering the above data, the expected returns from EDG can be expected to be about 11.15% Approximately over the next periods.
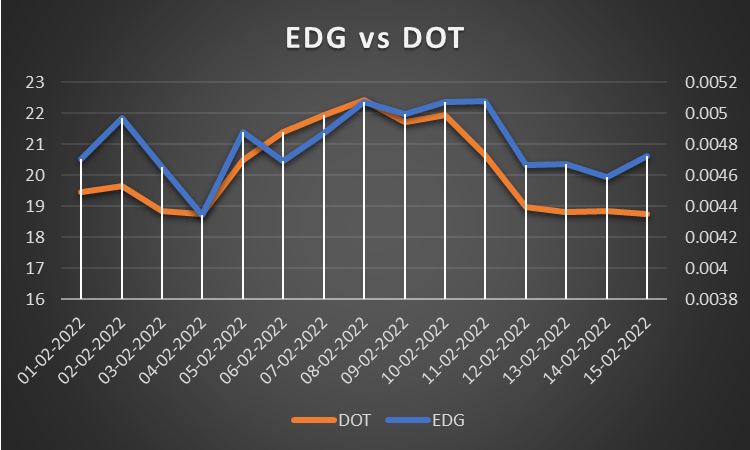
- Beta = 0.89 (Beta is less than 1 which shows EDG was less volatile as compared to DOT over the considered Period)
- The approximate Return over this period from EDG was about 0.37%
- The approximate Return over this period from DOT was about -3.72%
- **Considering the above data, the expected returns from EDG can be expected to be about 9.38% Approximately over the next periods.

- Beta = 0.82 (Beta is less than 1 which shows EDG was less volatile as compared to KSM over the considered Period)
- The approximate Return over this period from EDG was about 0.37%
- The approximate Return over this period from KSM was about 4.44%
- **Considering the above data, the expected returns from EDG can be expected to be about 8.93% Approximately over the next periods.

- Beta = 1.077 (Beta is more than 1 which shows EDG was more volatile as compared to ETH over the considered Period
- The approximate Return over this period from EDG was about 0.37%
- The approximate Return over this period from ETH was about 9.16%
- **Considering the above data, the expected returns. from EDG can be expected to be about 10.47% Approximately over the next periods.

- Beta = 0.82 (Beta is Less than 1 which shows EDG was less volatile as compared to AVAX over the considered Period)
- The approximate Return over this period from EDG was about 0.37%
- The approximate Return over this period from AVAX was about 16.98%
- **Considering the above data, the expected returns from EDG can be expected to be about 8.95% Approximately over the next periods.

- Beta = 1.11 (Beta is more than 1 which shows EDG was more volatile as compared to ALGO over the considered Period)
- The approximate Return over this period from EDG was about - 0.37%
- The approximate Return over this period from ALGO was about - 5.15%
- **Considering the above data, the expected returns from EDG can be expected to be about 10.66% Approximately over the next periods.
Conclusion:
Over the period considered for analysis, the EDG token was less volatile as compared to KSM, AVAX, and DOT and more volatile wrt ETH, ALGO, and BTC. Based on the financial models, **the returns over the next period can be expected to be positive and around 9% to 11% **
Part 3: Treasury Spendings
Treasury Proposals
- Treasury Proposal #45 - Kabocha Visuals + Crowdloan NFTs - Decent Partners - 2,894,736 EDG
Treasury Bounties
- Bounty#3 - Community Mods' incentives - 408,163.265 EDG